This weekend I co-presented a talk about monitoring Azure during the Global Azure Bootcamp in Linz. This post is the written form of my part from the talk. The source code can be found here.
Introduction
So first of all let’s talk about the most common misunderstanding: Many people think that Application Insights (AI) means that you have to run in Azure and you have to build your application on top of .net, or at least a Microsoft stack in order to use it. None of these is true! Application insights collects the date in Azure plus the UI is also there, but the application itself can run anywhere! On Premise, in another Cloud (like AWS), or in Azure, but this does not matter…you have full capabilities anywhere. Plus, it supports not only .Net, but also Java, Android, iOS, UWP, and almost everything which is widely used today.
So there are two main use cases for AI:
- You can analyze the usage patterns of your application, like plot Page view counts, platforms, geolocations and you can trace the usage path of your users to evaluate the success of a feature. You can do this on every single button and measure how many people click on it. Based on this you can deprecate features, which are not used at all.
- You can detect performance issues. You get out of the box very useful information about response times, CPU usage, dependency tracking (let’s say a REST service you use does not work..), and exception reports.
The basic architecture of Application Insights is this
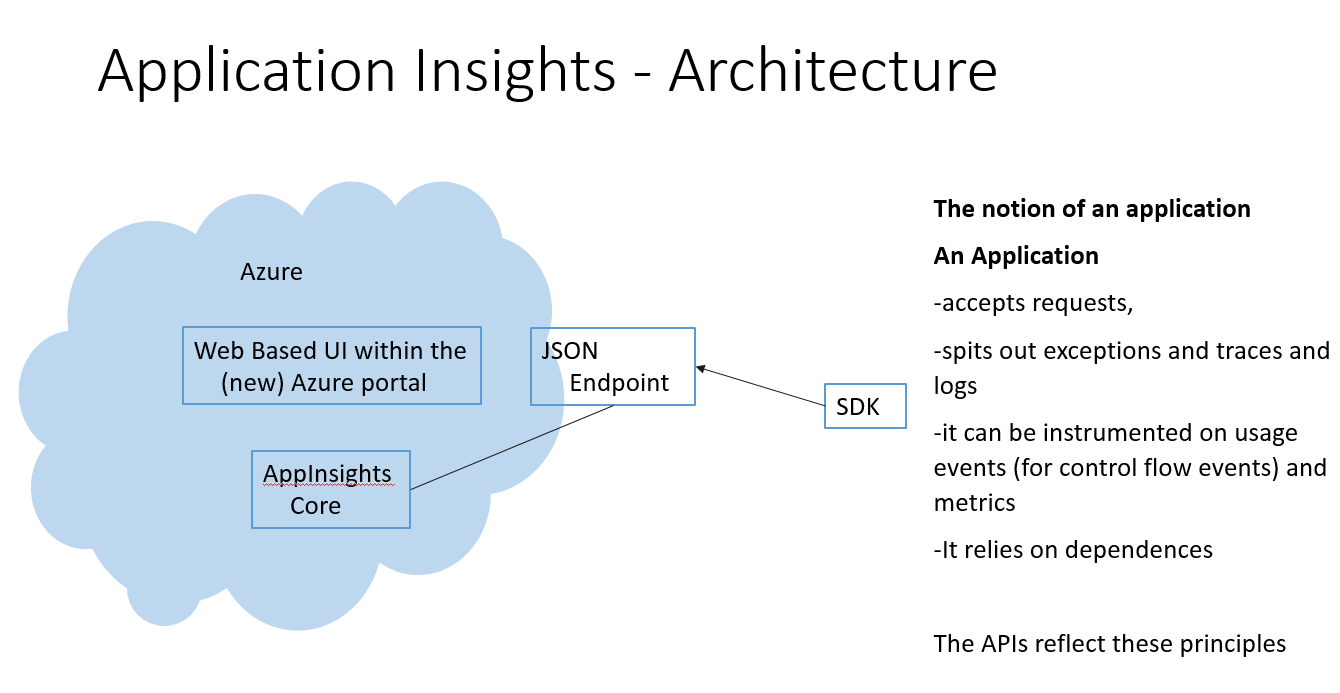
So the telemetry is sent to Azure and the UI is also on the Azure Portal. The telemetry is sent to Azure via JSON endpoints by the SDKs. A very important point is the “Notation of an application”. As long as your app plays within this rules (and these are so general, that I think most of the app are fine with that) you can use AI. The SDK reflects these principles.
Now the SDK itself delivers many data out of the box. For ASP.NET they have a module, and as every asp.net module it is triggered for every request, and this way it can send an incredible amount of information about the HTTP request (like response time, HTTP method (GET, POST, DELETE, etc.), response code (like 200, 400), etc.)
Demos
During the presentation I built a very simple application and showed how AI helps us to monitor the application. This is kind of a hello world app, so there is no user management, error handling, whatsoever in order to be able to build it quickly and to focus on the monitoring part. As always with these demo stuffs: do not do it this way in production!
The Demo app is a very simple story: you can create notes and they are shown on a website and in a UWP app.
I already created a database in Azure that is where all the notes are stored.
1. Creating the Web API controller.
The first project I added to the solution was the Web API controller.
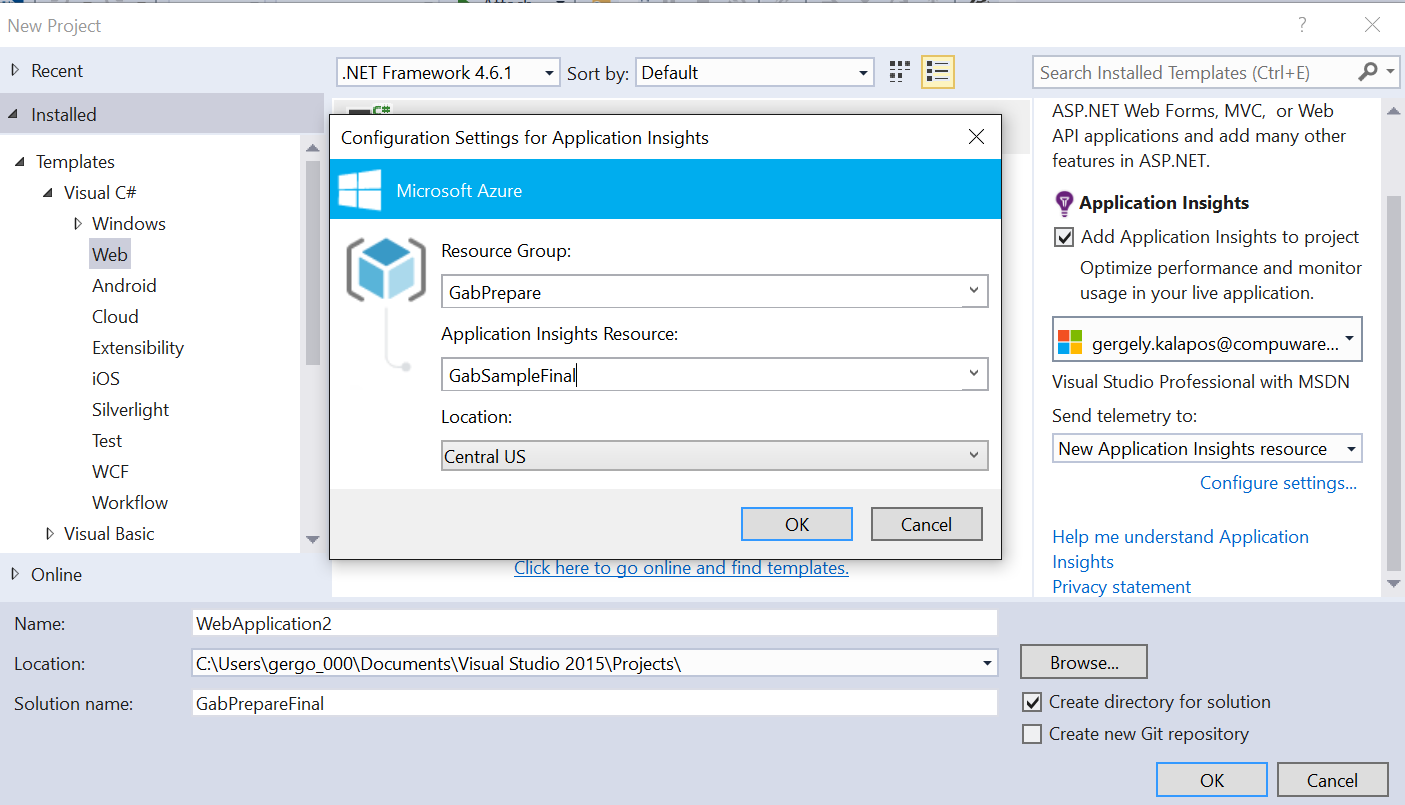
But before I created it I added AI to the project:
The controller is very simple. Here is the code for it:
public class NotesController : ApiController
    {
        private NotesDbContex _notesDbContext = new NotesDbContex();
        //private
        public IEnumerable<Note> GetAllNodes()
        {
            return _notesDbContext.Notes.ToList();
        }

        public bool CreateNote(Note NewNote)
        {
            _notesDbContext.Notes.Add(NewNote);
            _notesDbContext.SaveChanges();
            return true;
        }

    }
So it basically exposes the database through a REST interface with WebAPI.
The next step was to execute a GET and a POST request to this service (basically triggering the GetAllNotes and CreateNote methods.
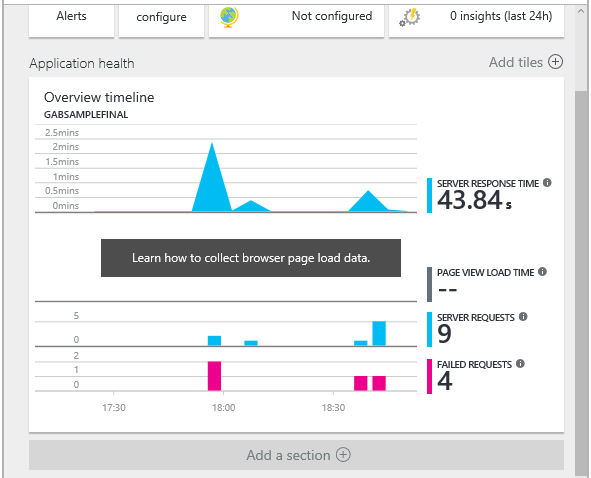
Now by looking into AI on the Azure portal we already saw many useful things like response time, failed requests.
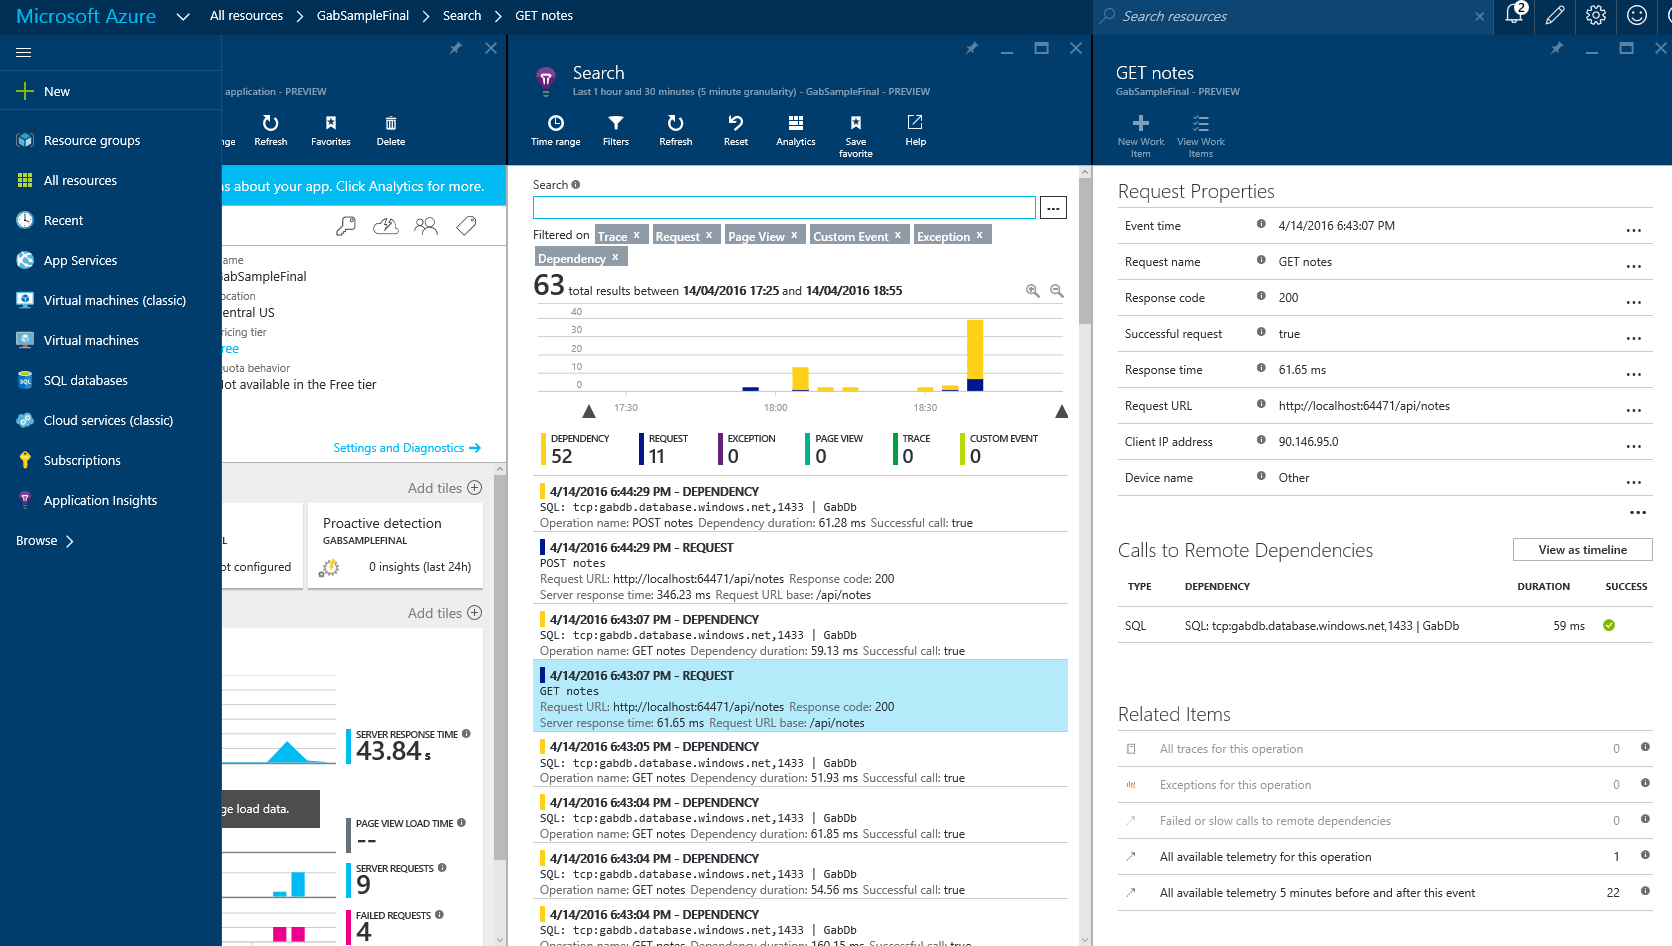
Plus, it also shows the dependencies of the service, in this case the Database. When the Db is dawn then you see a red mark instead of the green check mark below success. This way you know if a dependency is not available.
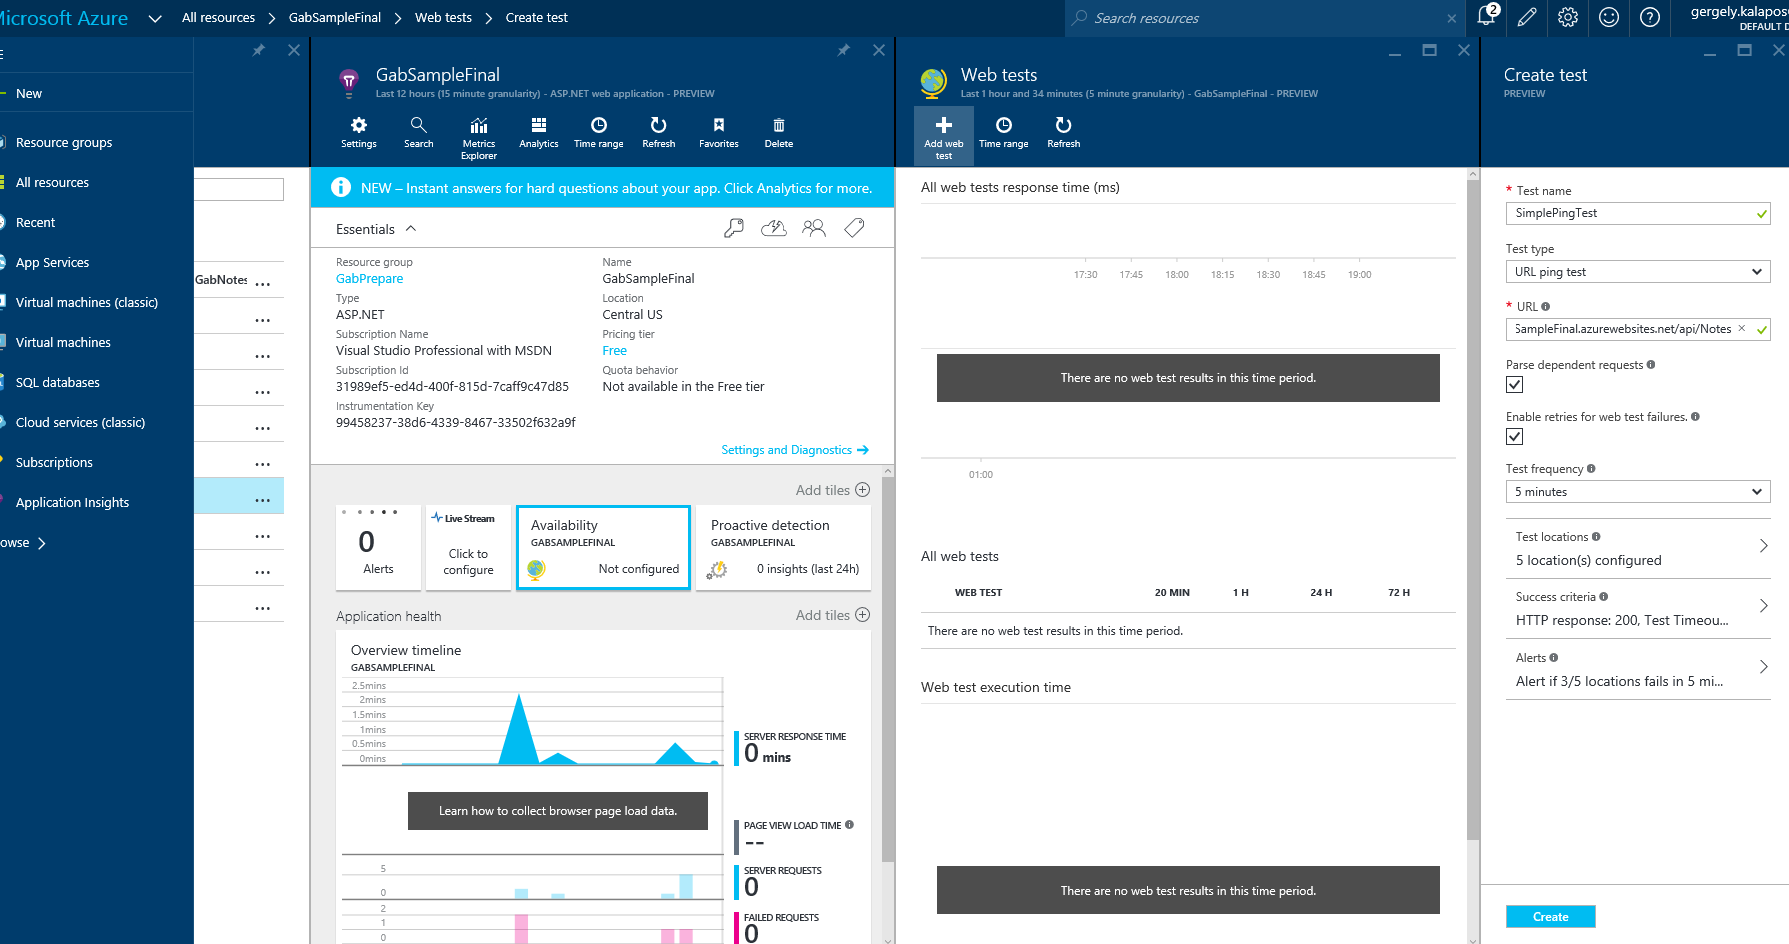
The next cool thing you get is Availability tests. You can configure ping event or deploy a VS test file, which will be executed from many datacenters of the world. Plus you can also define alerts for that (like when the response time of the service is more than 5sec then you get a mail)
And you also get out of the box information about your server health (like Process CPU, Available Memory, etc.)
2. The ASP.NET MVC frontend
The next part was a very simple MVC application which uses the Web API service to get and store the data.
First of all, it uses the GET method from the Web API to show all the notes. AI shows this dependency:
But the interesting part is in the Create(Note) Action method:
 [HttpPost]
 public ActionResult Create(Note note)
 {
    var visitorsIpAddress = GetIPAddress();
    string res = $"http://ipinfo.io/{visitorsIpAddress}/city";
    string ipResponse =  IpRequestHelper(res);
    note.City = ipResponse;
    System.Diagnostics.Trace.WriteLine($"User is from {ipResponse}");

    var response = PostHttp(SERVICEURIBASE,
     JsonConvert.SerializeObject(note));

    System.Diagnostics.Trace.WriteLine(
       $"response from {SERVICEURIBASE} POST: {response}");
     return RedirectToAction("Index");
  }
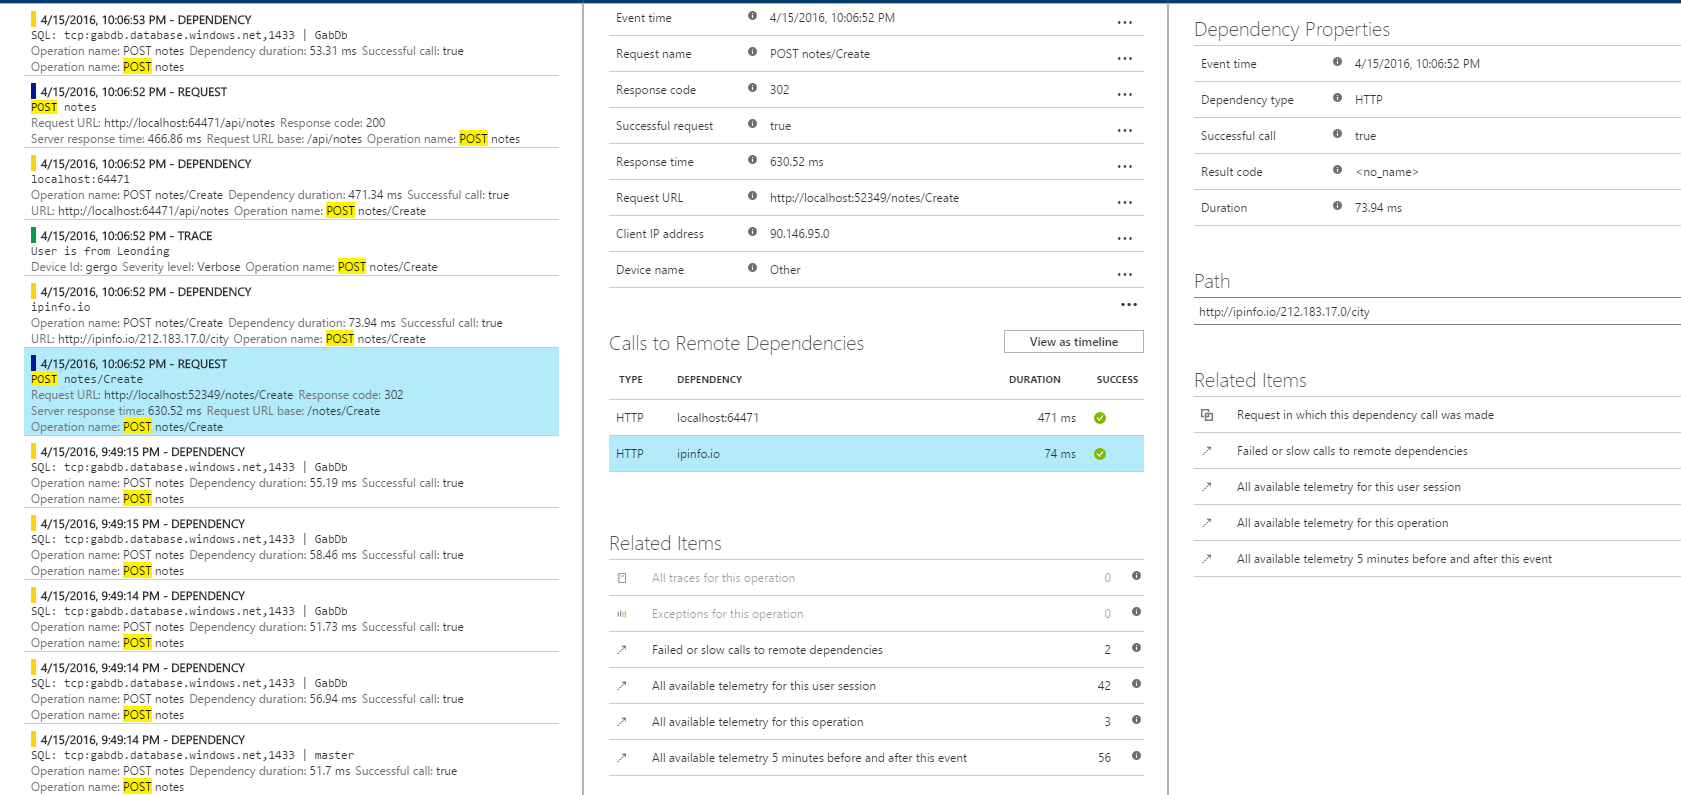
In the database we also store cities to the notes, but in this case the user does not have to enter the city, it will be automatically reversed from the IP address (ok, this is a little bit made up, but great for demonstration). In this case this request has two dependencies: 1) the Web API REST service and 2) the ipinfo.io service. And all this is shown by AI, and you also see how much time the dependency contributes to the request.
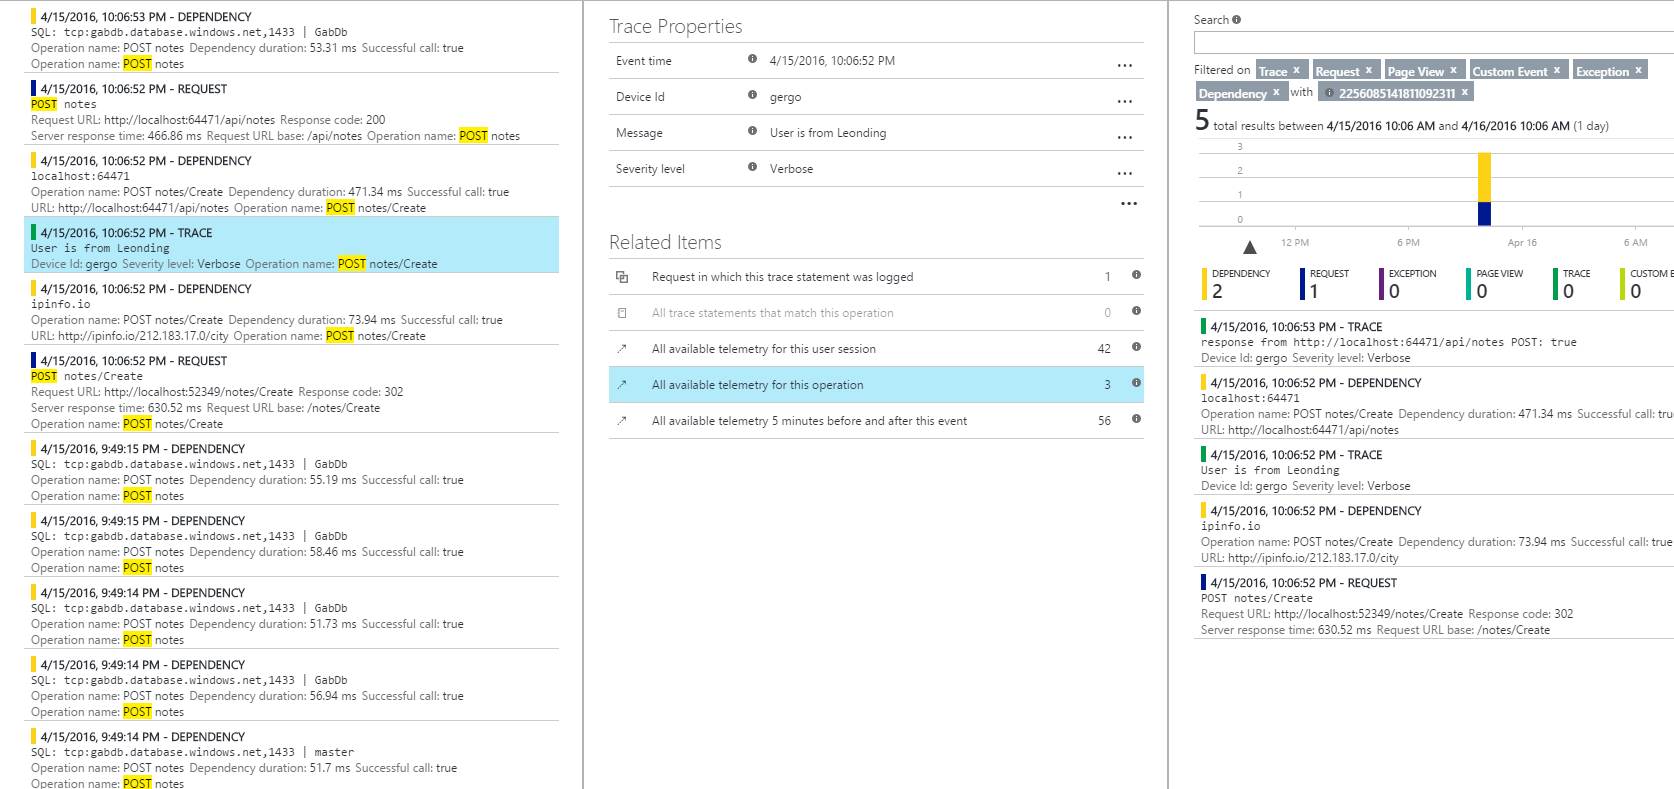
The next part is Tracing: Many applications already use some kind of tracing, like System.Diagnostics.Trace or Log4net, or NLog. AI can take advantage from this. There are trace listeners for these frameworks. For example for System.Diagnostics.Trace I only had to install the Microsoft.ApplicationInsights.TraceListener NuGet package and from that point all the Traces were automatically sent to AI and grouped to the request. So on a per Request basis I was able to see the traces.
3. UWP App
Not only web apps can benefit from AI. iOS, Android, and UWP apps can also be monitored. In order to monitor a UWP app you have to add the UWP AI package to the app and initialize it in the App.xaml.cs file like this:
public App()
{
 Microsoft.ApplicationInsights.WindowsAppInitializer.
    InitializeAsync("YOUR IKey",
     Microsoft.ApplicationInsights.WindowsCollectors.PageView |
     Microsoft.ApplicationInsights.WindowsCollectors.Metadata |
     Microsoft.ApplicationInsights.WindowsCollectors.UnhandledException |
     Microsoft.ApplicationInsights.WindowsCollectors.Session);
         this.InitializeComponent();
         this.Suspending += OnSuspending;
}
After this you will have automatically traces for PageView loads and unhandled exception.
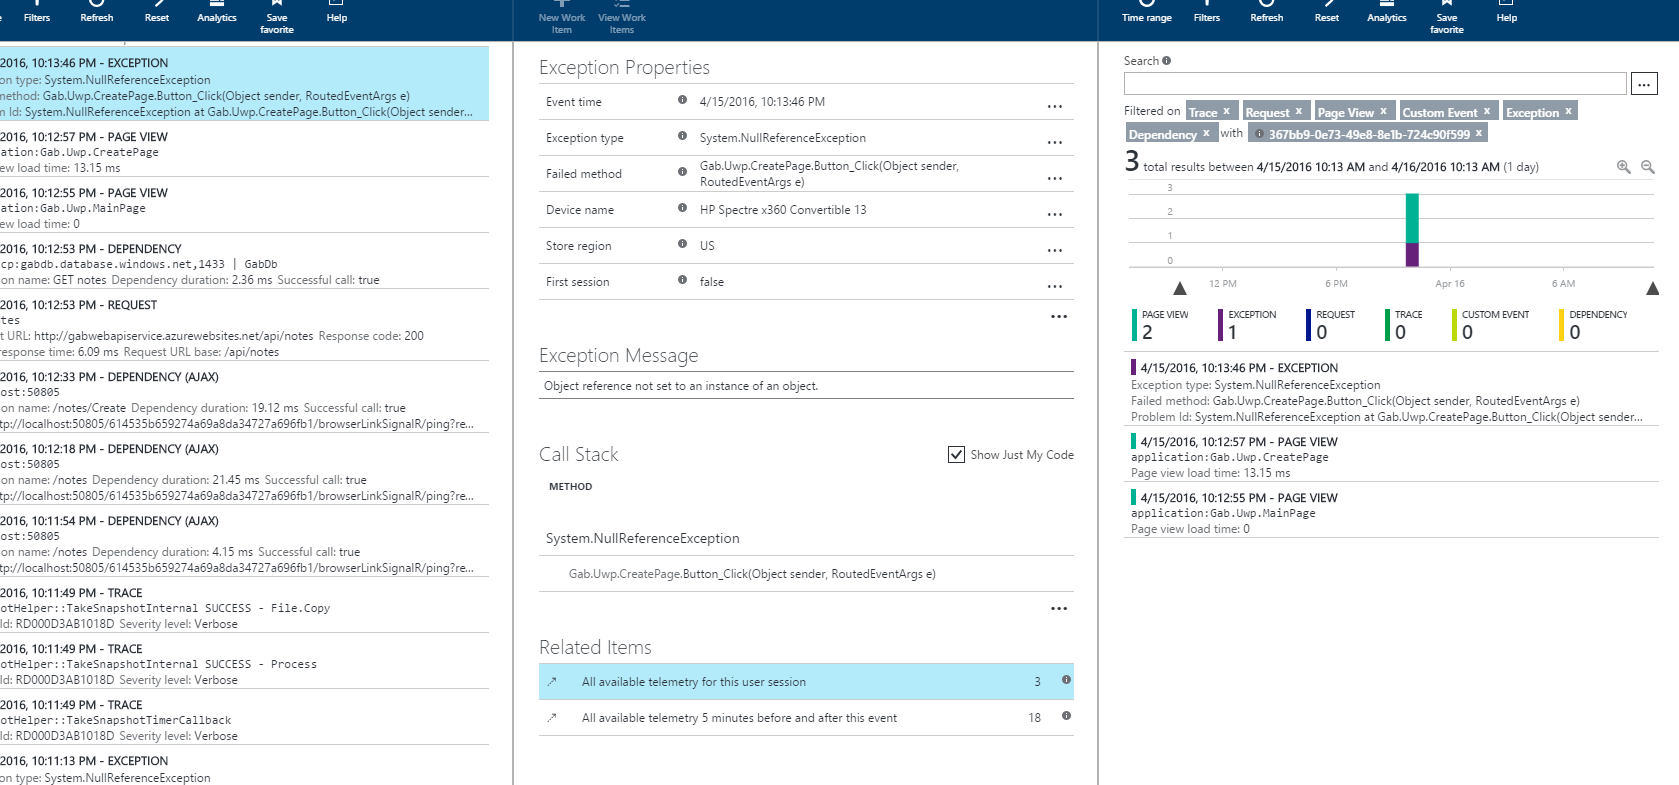
What you can get with this is really powerful. What you see on the next screenshot is a session for an exception. We basically see that the user went to the MainPage then to the CreatePage and then there the Gab.Uwp.CreatePage.Button_Click(Object sender, RoutedEventArgs e) was called and it threw a a NullReferenceException. With this you are basically able to reproduce crashes without asking a single question from the user.
4. Console application with manual traces.
Until this point everything was delivered automatically without writing any code (except the Traces). This is because most of the frameworks provide hooks and callbacks for different events (e.g. in ASP.NET you can catch every request with a module..). But you can do the whole thing manually for any application. As long as you play the roles described above (tracing requests, splitting exceptions and traces and having dependencies) you can monitor your application with AI.
This small Console App is from a cool session from Build 2015. It is while loop, which runs until the question “Should I use APM?” is answered with “Yes!”.
Here is the code:
namespace ConsoleApplicationSample {
class Program {

  static string iKey = "8b25d784-e6f9-4bf3-870d-31e77bebe01e";
  static TelemetryClient ctx = new TelemetryClient();

  static void Main(string[] args) {
  Microsoft.ApplicationInsights.Extensibility.
     TelemetryConfiguration.Active.InstrumentationKey = iKey;
  while(AskQuestion() ) {
  }

  Thread.Sleep(70000);
  }

  private static bool AskQuestion() {
  Console.WriteLine("Should I use APM? \r\n>>");

  DateTimeOffset date = DateTimeOffset.Now;
  Stopwatch sw = new Stopwatch();
  sw.Start();
  string answer  = Console.ReadLine();
  bool correctAnswer = answer == "Yes!";
  ctx.TrackRequest(answer, date, new TimeSpan(sw.ElapsedTicks),
   "200", correctAnswer);

  return !correctAnswer;
  }
 }
}
It references the AI core package and measures every loop iteration and sends the answer to AI with the time the user toke to answer the question.
What you see from this in AI is this:
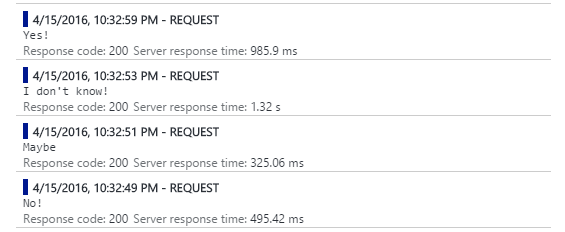
So it basically shows all the answers with the times.
Resources
https://azure.microsoft.com/en-us/documentation/services/application-insights/
https://channel9.msdn.com/Events/Build/2016/B838
https://channel9.msdn.com/Events/Build/2015/3-719
https://channel9.msdn.com/Shows/Azure-Friday/Instrumenting-your-Web-API-using-Application-Insights-with-Victor-Mushkatin
https://channel9.msdn.com/Events/Build/2015/3-624